Typedream x AmCharts
A guide on how to add charts, diagrams, maps, and timelines to your website.
Widget
How does this integration work?

First, create a landing page on Typedream
Second, insert code snippets for a chart or map from AmCharts
Then, make it easy for users to understand your data
Uses.
Bring numbers to life
People love numbers and data. It builds credibility. But numbers aren't always easy to digest. That's when using a simple yet powerful data visualization tool like amCharts on your site can be helpful. Plus, who doesn't like a sexy chart?

Adding amCharts to Typedream.
Step 1
Step 2
Step 3
Step 4
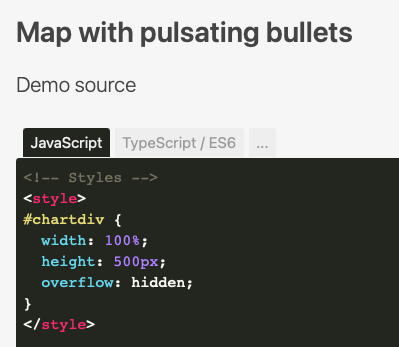
Example: Map with pulsating bullets
<!-- Resources --><script src="https://cdn.amcharts.com/lib/4/core.js"></script><script src="https://cdn.amcharts.com/lib/4/maps.js"></script><script src="https://cdn.amcharts.com/lib/4/geodata/worldLow.js"></script><script src="https://cdn.amcharts.com/lib/4/themes/animated.js"></script><!-- Chart code --><script>am4core.ready(function() {// Themes beginam4core.useTheme(am4themes_animated);// Themes end// Create map instancevar chart = am4core.create("chartdiv", am4maps.MapChart);// Set map definitionchart.geodata = am4geodata_worldLow;// Set projectionchart.projection = new am4maps.projections.Miller();// Create map polygon seriesvar polygonSeries = chart.series.push(new am4maps.MapPolygonSeries());// Exclude AntarticapolygonSeries.exclude = ["AQ"];// Make map load polygon (like country names) data from GeoJSONpolygonSeries.useGeodata = true;// Configure seriesvar polygonTemplate = polygonSeries.mapPolygons.template;polygonTemplate.tooltipText = "{name}";polygonTemplate.polygon.fillOpacity = 0.6;// Create hover state and set alternative fill colorvar hs = polygonTemplate.states.create("hover");hs.properties.fill = chart.colors.getIndex(0);// Add image seriesvar imageSeries = chart.series.push(new am4maps.MapImageSeries());imageSeries.mapImages.template.propertyFields.longitude = "longitude";imageSeries.mapImages.template.propertyFields.latitude = "latitude";imageSeries.mapImages.template.tooltipText = "{title}";imageSeries.mapImages.template.propertyFields.url = "url";var circle = imageSeries.mapImages.template.createChild(am4core.Circle);circle.radius = 3;circle.propertyFields.fill = "color";circle.nonScaling = true;var circle2 = imageSeries.mapImages.template.createChild(am4core.Circle);circle2.radius = 3;circle2.propertyFields.fill = "color";circle2.events.on("inited", function(event){ animateBullet(event.target);})function animateBullet(circle) { var animation = circle.animate([{ property: "scale", from: 1 / chart.zoomLevel, to: 5 / chart.zoomLevel }, { property: "opacity", from: 1, to: 0 }], 1000, am4core.ease.circleOut); animation.events.on("animationended", function(event){ animateBullet(event.target.object); })}var colorSet = new am4core.ColorSet();] "title": "Copenhagen", "latitude": 55.6763, "longitude": 12.5681, "color":colorSet.next()}, { "title": "Paris", "latitude": 48.8567, "longitude": 2.3510, "color":colorSet.next()}, { "title": "Reykjavik", "latitude": 64.1353, "longitude": -21.8952, "color":colorSet.next()}, { "title": "Moscow", "latitude": 55.7558, "longitude": 37.6176, "color":colorSet.next()}, { "title": "Madrid", "latitude": 40.4167, "longitude": -3.7033, "color":colorSet.next()}, { "title": "London", "latitude": 51.5002, "longitude": -0.1262, "url": "http://www.google.co.uk", "color":colorSet.next()}, { "title": "Peking", "latitude": 39.9056, "longitude": 116.3958, "color":colorSet.next()}, { "title": "New Delhi", "latitude": 28.6353, "longitude": 77.2250, "color":colorSet.next()}, { "title": "Tokyo", "latitude": 35.6785, "longitude": 139.6823, "url": "http://www.google.co.jp", "color":colorSet.next()}, { "title": "Ankara", "latitude": 39.9439, "longitude": 32.8560, "color":colorSet.next()}, { "title": "Buenos Aires", "latitude": -34.6118, "longitude": -58.4173, "color":colorSet.next()}, { "title": "Brasilia", "latitude": -15.7801, "longitude": -47.9292, "color":colorSet.next()}, { "title": "Ottawa", "latitude": 45.4235, "longitude": -75.6979, "color":colorSet.next()}, { "title": "Washington", "latitude": 38.8921, "longitude": -77.0241, "color":colorSet.next()}, { "title": "Kinshasa", "latitude": -4.3369, "longitude": 15.3271, "color":colorSet.next()}, { "title": "Cairo", "latitude": 30.0571, "longitude": 31.2272, "color":colorSet.next()}, { "title": "Pretoria", "latitude": -25.7463, "longitude": 28.1876, "color":colorSet.next()} ];}); // end am4core.ready()</script>
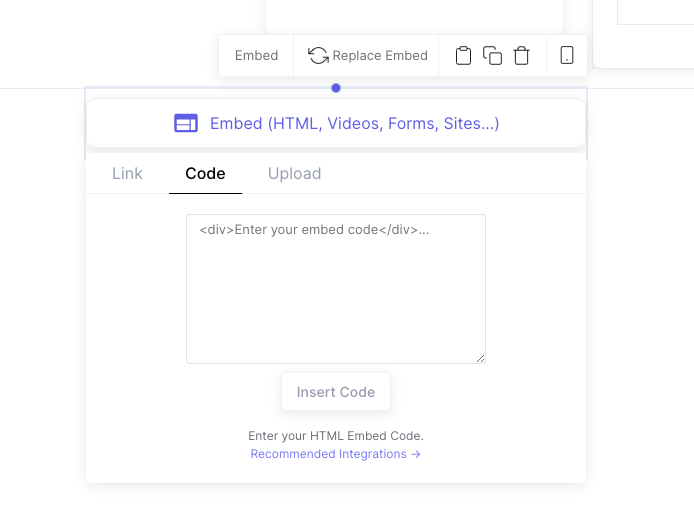
Step 5
/embed > Code<div id="chartdiv"></div>But wait, what's amCharts?

amCharts is JavaScript charting library that offers sleek, flexible charts and maps. You can add anything from Gantt charts to geo heat maps to waterfalls to candlesticks. amCharts is used by companies like Microsoft and Apple.
Start building your dream site today.
The world needs to see your awesome idea.
Related guides
We're a remote software company, building online tools for creators, builders, and side hustlers. We quit our 9-5 to pursue our dreams, and we want to help others do the same.
Backed by
Copyright © 2023 Govest, Inc. All rights reserved.